What open interest is in crypto and how to read it
- OI rises when new positions enter the market. It falls when positions close, liquidations included.
- Rising OI doesn't tell you where price will go: every new long has a new short.
- Read OI together with price: the price + OI pair shows what is driving the move.
- OI in dollars also grows from price alone — check inflows in coins.


How open interest changes: three trades, step by step
- Trade 1: OI 0 → 10. Trader A opens a long for 10 contracts, trader B opens a short for 10. Both positions are new, so 10 contracts are now open.
- Trade 2: OI stays at 10. Trader C opens a long for 5 contracts, and the seller is trader A, closing half of their long. One position opened, another closed — the contracts just changed hands.
- Trade 3: OI 10 → 5. Trader A closes the remaining 5 contracts of the long, and the buyer is trader B, closing 5 contracts of the short. Both sides closed, so fewer contracts are open.
Open interest, volume, and dollars: what not to mix up
Volume is what traded, OI is what stays open
Volume shows how many contracts were traded over a period. Open interest shows how many are open right now. In the example above volume is 20 contracts, while OI only rose to 5. In a live market a pair can trade tens of millions of dollars in an hour with OI barely moving: some traders closed as much as others opened. Volume answers “how actively is it traded”, OI answers “are new positions coming in”.OI in dollars grows without new positions
Exchanges and aggregators often show OI in dollars: open contracts multiplied by price. An illustrative example: positions for 1,000 BTC are open at a price of $60,000 — that's $60m. Price rises 10% to $66,000, and OI in dollars becomes $66m, even though not a single new position was opened. So during a strong move, check OI in coins or contracts, not only in dollars.OI is counted on each exchange separately
A jump on a venue where the coin has little money behind it may mean almost nothing for the market as a whole. That's why it matters which exchange OI rose on and how much is open there. You can compare venues for a coin on the open interest by exchange page.Compare the change, not absolute numbers
Exchanges count OI differently: some include both sides of the contract, so absolute values from different venues aren't directly comparable. Compare the change instead: say, OI rose 8% in an hour on one exchange and 1% on another — then new positions are mostly being opened on the first one.
How to tell what is driving the price
| Price and OI | What is happening |
|---|---|
| Price ↑ OI ↑ | New positions open on the rise: new money is entering the move. For example, the coin is +4% in an hour and OI is +6%. |
| Price ↓ OI ↑ | New positions open on the drop: sellers are actively opening shorts. |
| Price ↑ OI ↓ | The rise runs on positions closing: shorts are buying back, some by force. That's a short squeeze, and it can end once there's nothing left to close. |
| Price ↓ OI ↓ | The drop runs on positions closing: longs are exiting or getting liquidated (a long squeeze). |
| Price flat, OI ↑ | Positions pile up on both sides. The breakout from the range can be sharp, but OI won't tell you which way. |
A chart example: XRP/USDT
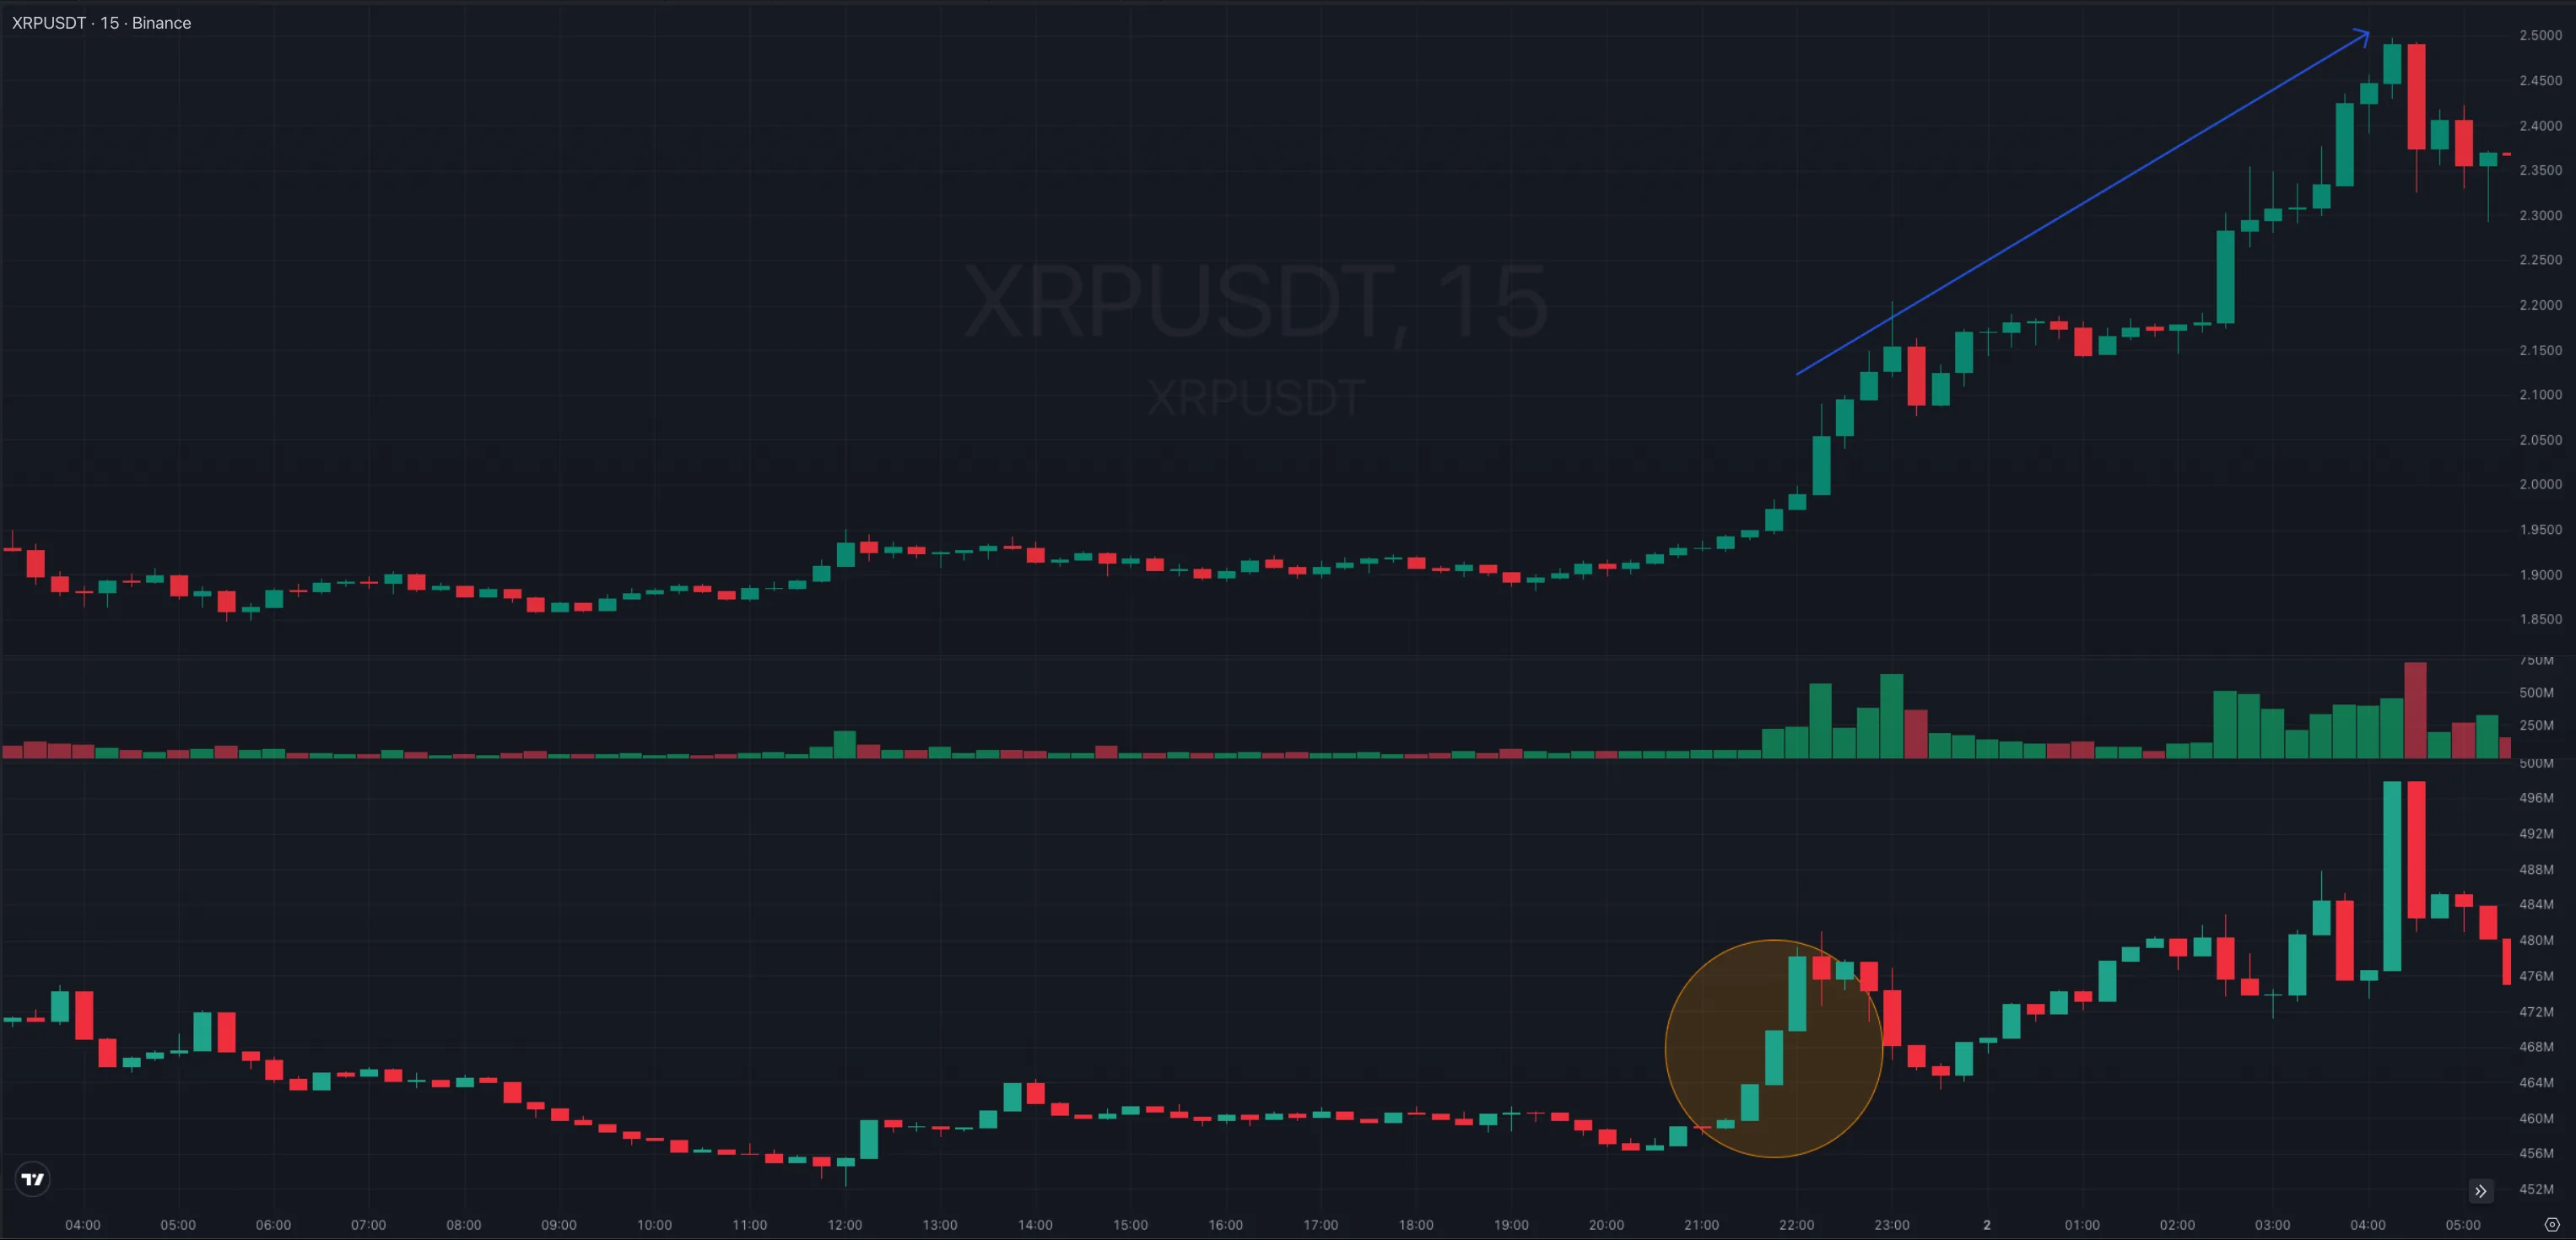
(from $1.9 to $2.5)
Common mistakes when reading OI
The low-base effect
If very little is open on a coin, +20% OI is a handful of positions. The percentage looks loud, and the market won't notice. Check the absolute size and the turnover too.Summing all exchanges
The total hides where OI actually grew. A sharp jump on one small venue barely shows in the sum, while a visible rise on a large one can mean more than the overall percentage suggests.Dollar growth taken for new positions
If price rose 15%, OI in dollars rises the same 15% without a single new trade. Before concluding that positions are flowing in, check OI in coins.Reading growth after a crash as buyers returning
After a sharp price drop OI usually sinks: longs close, some of them by force. If OI then climbs again, it may be new shorts from traders expecting the drop to continue rather than returning buyers. Without price and funding you can't tell these apart.OI instead of a decision
Open interest shows that positions have appeared or disappeared. Levels, the higher-timeframe trend, volume, and per-trade risk still have to be checked separately.Open interest FAQ
What does rising open interest mean?
New positions have opened on the pair: money has entered the market. Rising OI shows no direction, because every new long has a new short on the other side. Read it together with price: rising OI on a rally and on a drop mean different things.
Is open interest bullish or bearish?
Neither. OI shows how many positions are open, not which way they point. The balance between longs and shorts shows up indirectly in the funding rate.
How is open interest different from trading volume?
Volume is how many contracts were traded over a period. Open interest is how many contracts are open right now. Volume can be high while OI stays flat, if some traders close as much as others open.
Why did OI in dollars rise with no new positions?
OI in dollars is open contracts multiplied by price. When price rises 10%, OI in dollars rises 10% too, without a single new trade. Check OI in coins or contracts to see whether positions are flowing in.
What happens to open interest during liquidations?
A liquidation is a forced close, so OI falls. A sharp drop in OI during a strong price move usually means a wave of liquidations.
Does open interest exist on the spot market?
No. On spot a trade completes at once: the coin is bought and no open position remains. Open interest exists only on futures.
What is a short squeeze?
A price rise that runs on shorts closing: sellers buy their positions back, some of them by force through liquidation. That is why in a short squeeze price rises while open interest falls. The move can end once there is nothing left to close.