What trading volume is in crypto and how it differs from turnover
- Volume is how many coins traded over a period; turnover is the same in dollars. Coins can only be compared with each other by turnover.
- “24h volume” is a rolling window: the number drops when yesterday's busy hour falls out of it.
- Volume shows no direction: every trade has both a buyer and a seller.
- A spike is measured against the coin's own usual level. A spike on one exchange while the rest stay quiet is a reason to suspect a thin market or wash trading.


Volume or turnover: which to watch and why coins are compared in dollars
| Illustrative example | Coin A | Coin B |
|---|---|---|
| Price | $0.0002 | $60,000 |
| 24h volume | 25bn coins | 1,200 coins |
| 24h turnover | $5m | $72m |
On futures, volume may be in contracts
Some futures exchanges show volume in contracts, and one contract isn't always one coin: it can be 0.01 BTC or 10 coins. An illustrative example: 50,000 contracts of 0.01 BTC is 500 BTC, not 50,000. Before comparing volume across two exchanges, check the contract size or look at turnover in dollars.Why 24h volume drops while trading looks normal
Rolling window: yesterday's spike drops out of the sum
Every minute a new minute enters the window and the minute from a day ago leaves it. An illustrative example: a pair traded $100m over a day, and $30m of that came in one hour yesterday after some news. Today the same hour brought $5m — so an hour later, daily turnover is $75m: −25% while trading right now is normal.Candle volume and daily volume are different numbers
Candle volume is how much traded during that candle, such as one minute. Daily volume is the sum of 1,440 such minutes. An illustrative example: with $100m of daily turnover, the average minute is about $69,000. A $2m minute is almost 30 times the average, yet it moves the daily sum by only about 2%. So even a small percentage change in daily volume over a few minutes can mean a strong spike.Volume shows no direction
A common mistake: “volume is up, so people are buying.” Every trade has both a buyer and a seller, so volume answers “how actively is it traded,” not “which way.” Direction comes from price. An illustrative example: turnover tripled while price didn't move — buying and selling balanced each other out.Volume and open interest aren't the same
Volume shows how much traded over a period; open interest shows how many futures positions are open right now. An illustrative example: 20 contracts traded on a pair in an hour, yet open interest rose by only 5 — some trades were closing old positions. More in the article on open interest.What a volume spike is and how to catch one
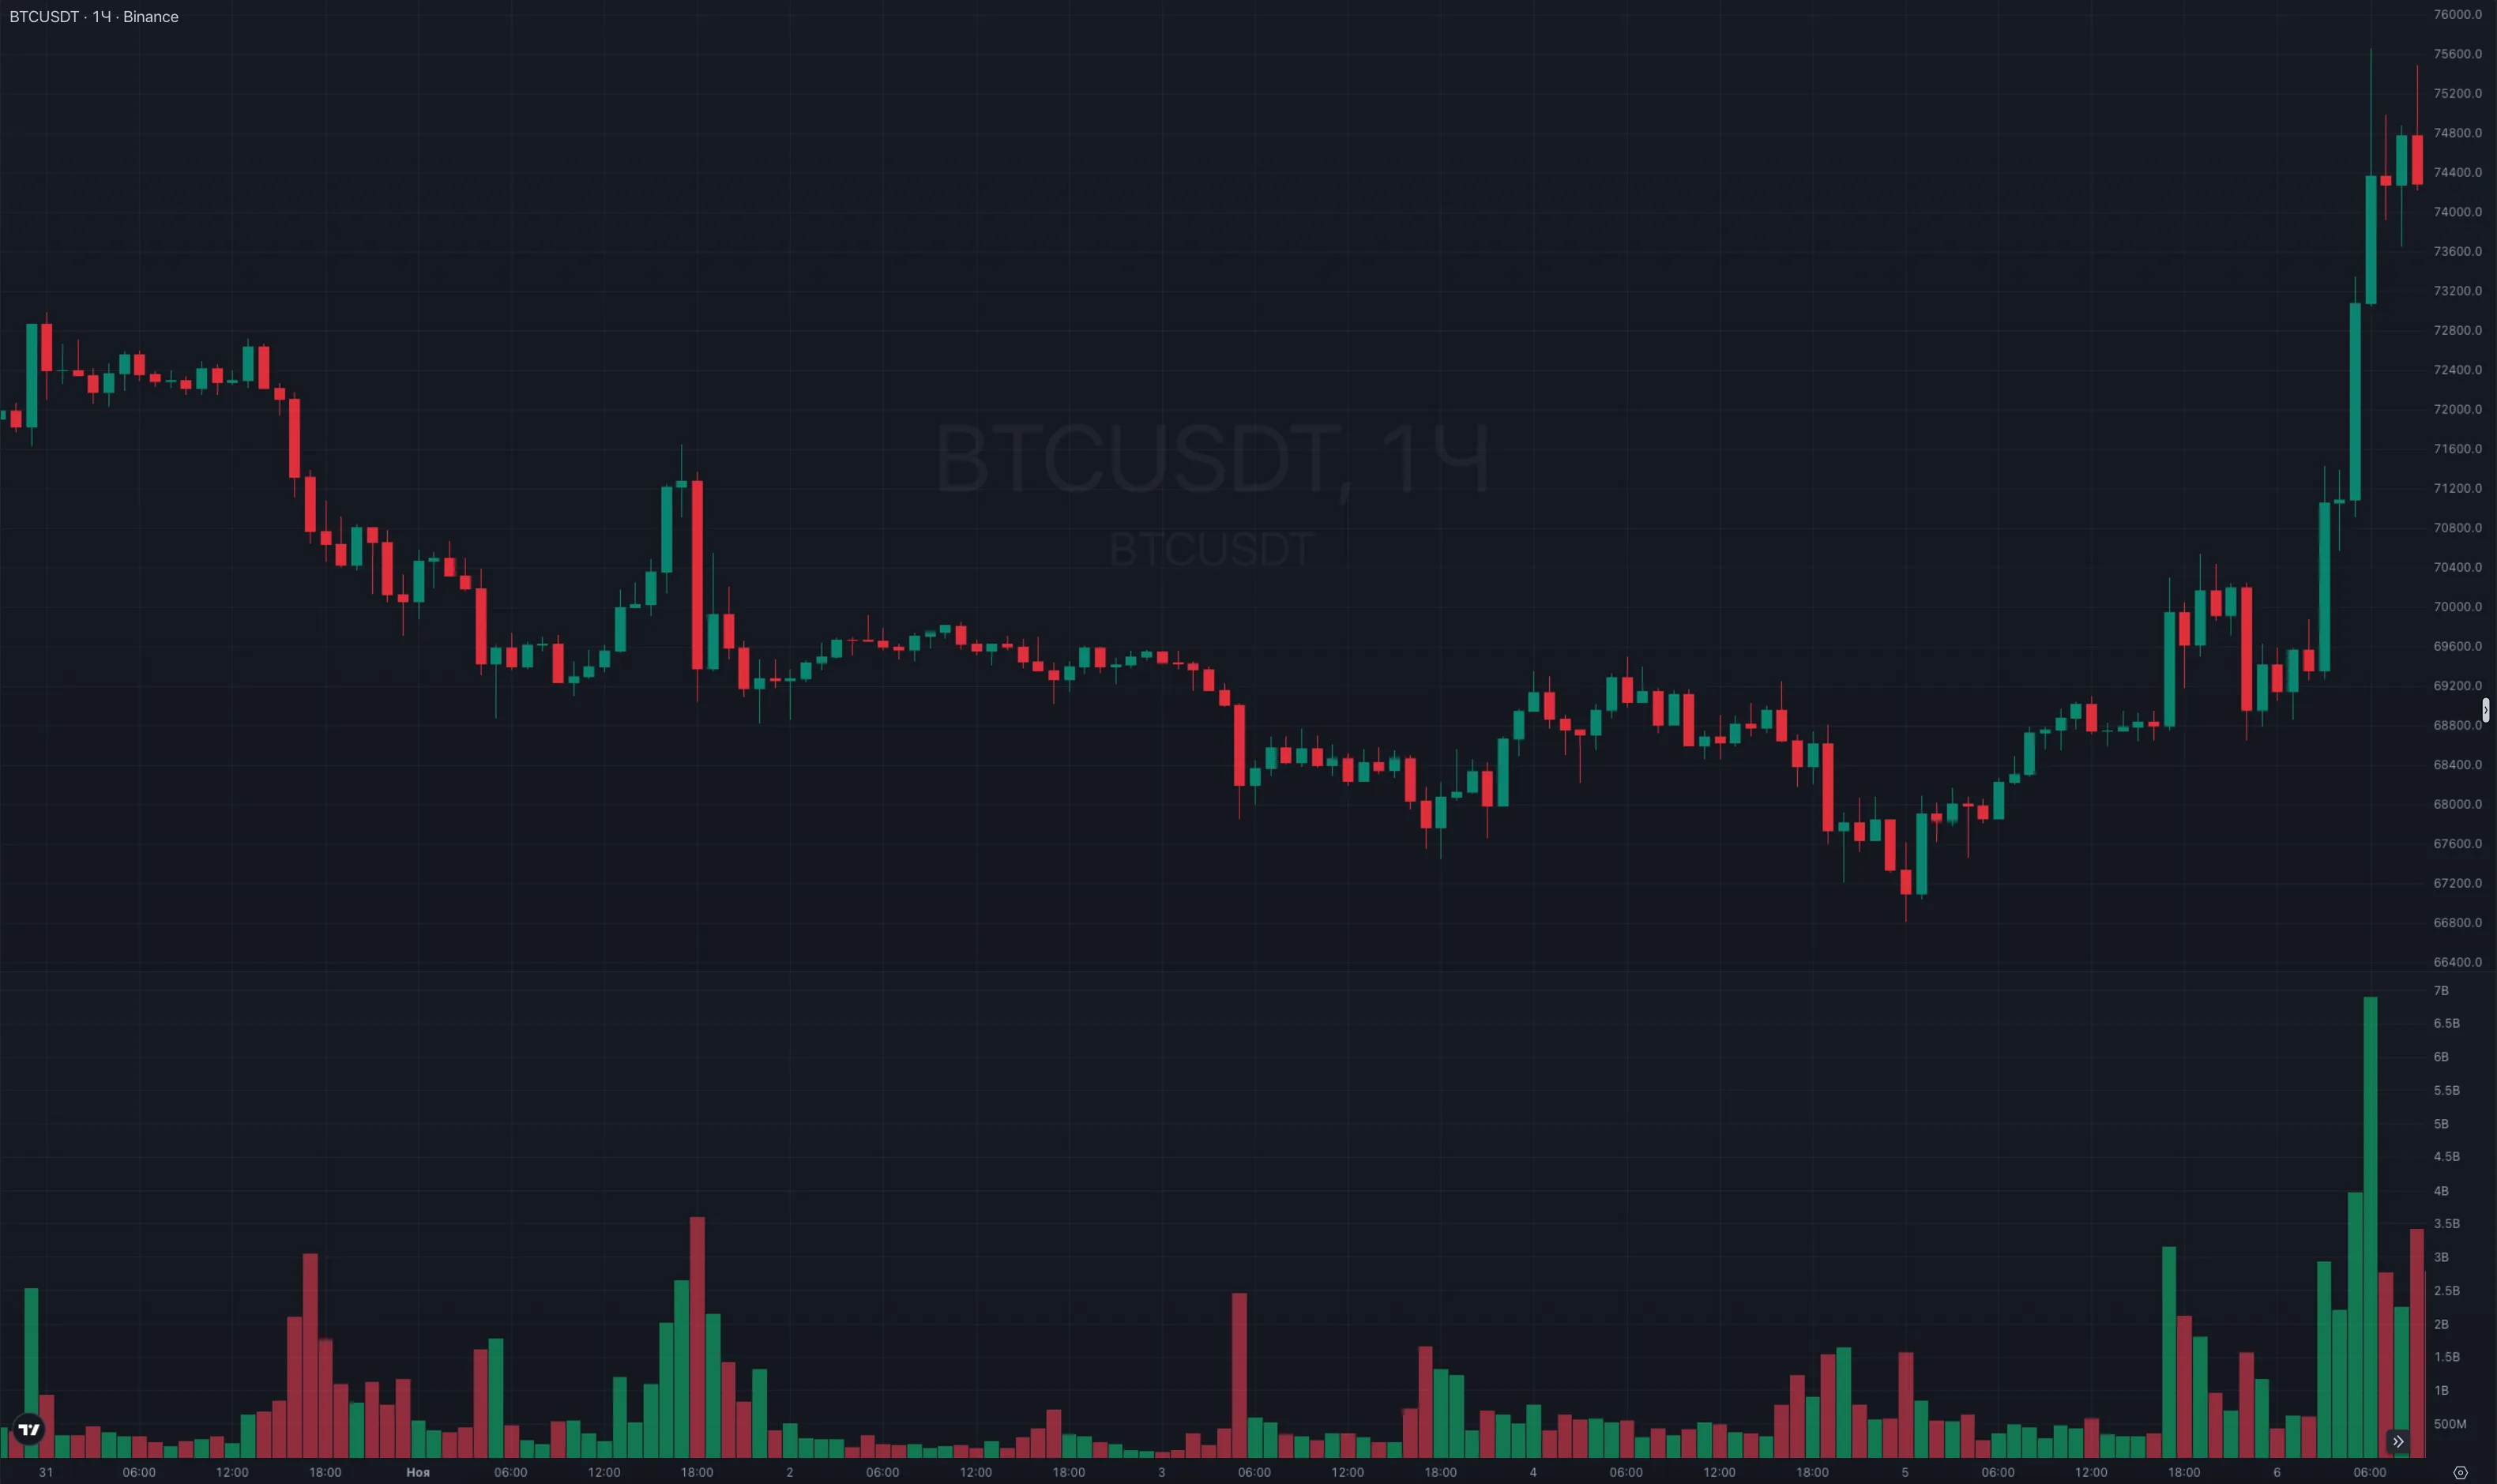
| Volume and price | What it means |
|---|---|
| Volume ↑, price ↑ or ↓ | The move ran on real trades, not through an empty order book. |
| Volume ↑, price flat | Buying and selling balance each other out. A reason to open the chart, not a ready direction. |
| Price ↑ or ↓, volume unchanged | A few trades made the move. Check the order book and the price on other exchanges. |
When not to trust volume: wash trading, a single exchange, and a low base
Wash trading
Wash trading is trading with yourself to make a coin or an exchange look active. The trades go through, but the money goes in circles and doesn't move price. An illustrative example: an exchange shows $30m of daily turnover on a pair, the book holds only $15,000 of orders within 2% of the price, and price changed 0.1% over the day. Huge turnover with a thin book and a price that stands still is the main sign of wash trading.A spike on one exchange
If turnover jumped on one venue while the rest stay quiet, that's a reason for skepticism, not confirmation of interest. An illustrative example: on a small exchange a pair's turnover rose from $2m to $12m, while on three large ones it didn't change. First figure out what's happening on that exchange, not in the market.The low-base effect
On thin coins percentages look loud. An illustrative example: turnover rose from $10,000 to $40,000 — that's +300%, yet only $30,000 of trades stand behind it. For a coin with $500m of turnover, a 10% rise is $50m. Look at both the percentage and the amount.Billions on cheap coins
The volume-in-coins column for a coin priced at $0.00001 shows billions, but 5bn of those coins is only $50,000. Compare by turnover in dollars.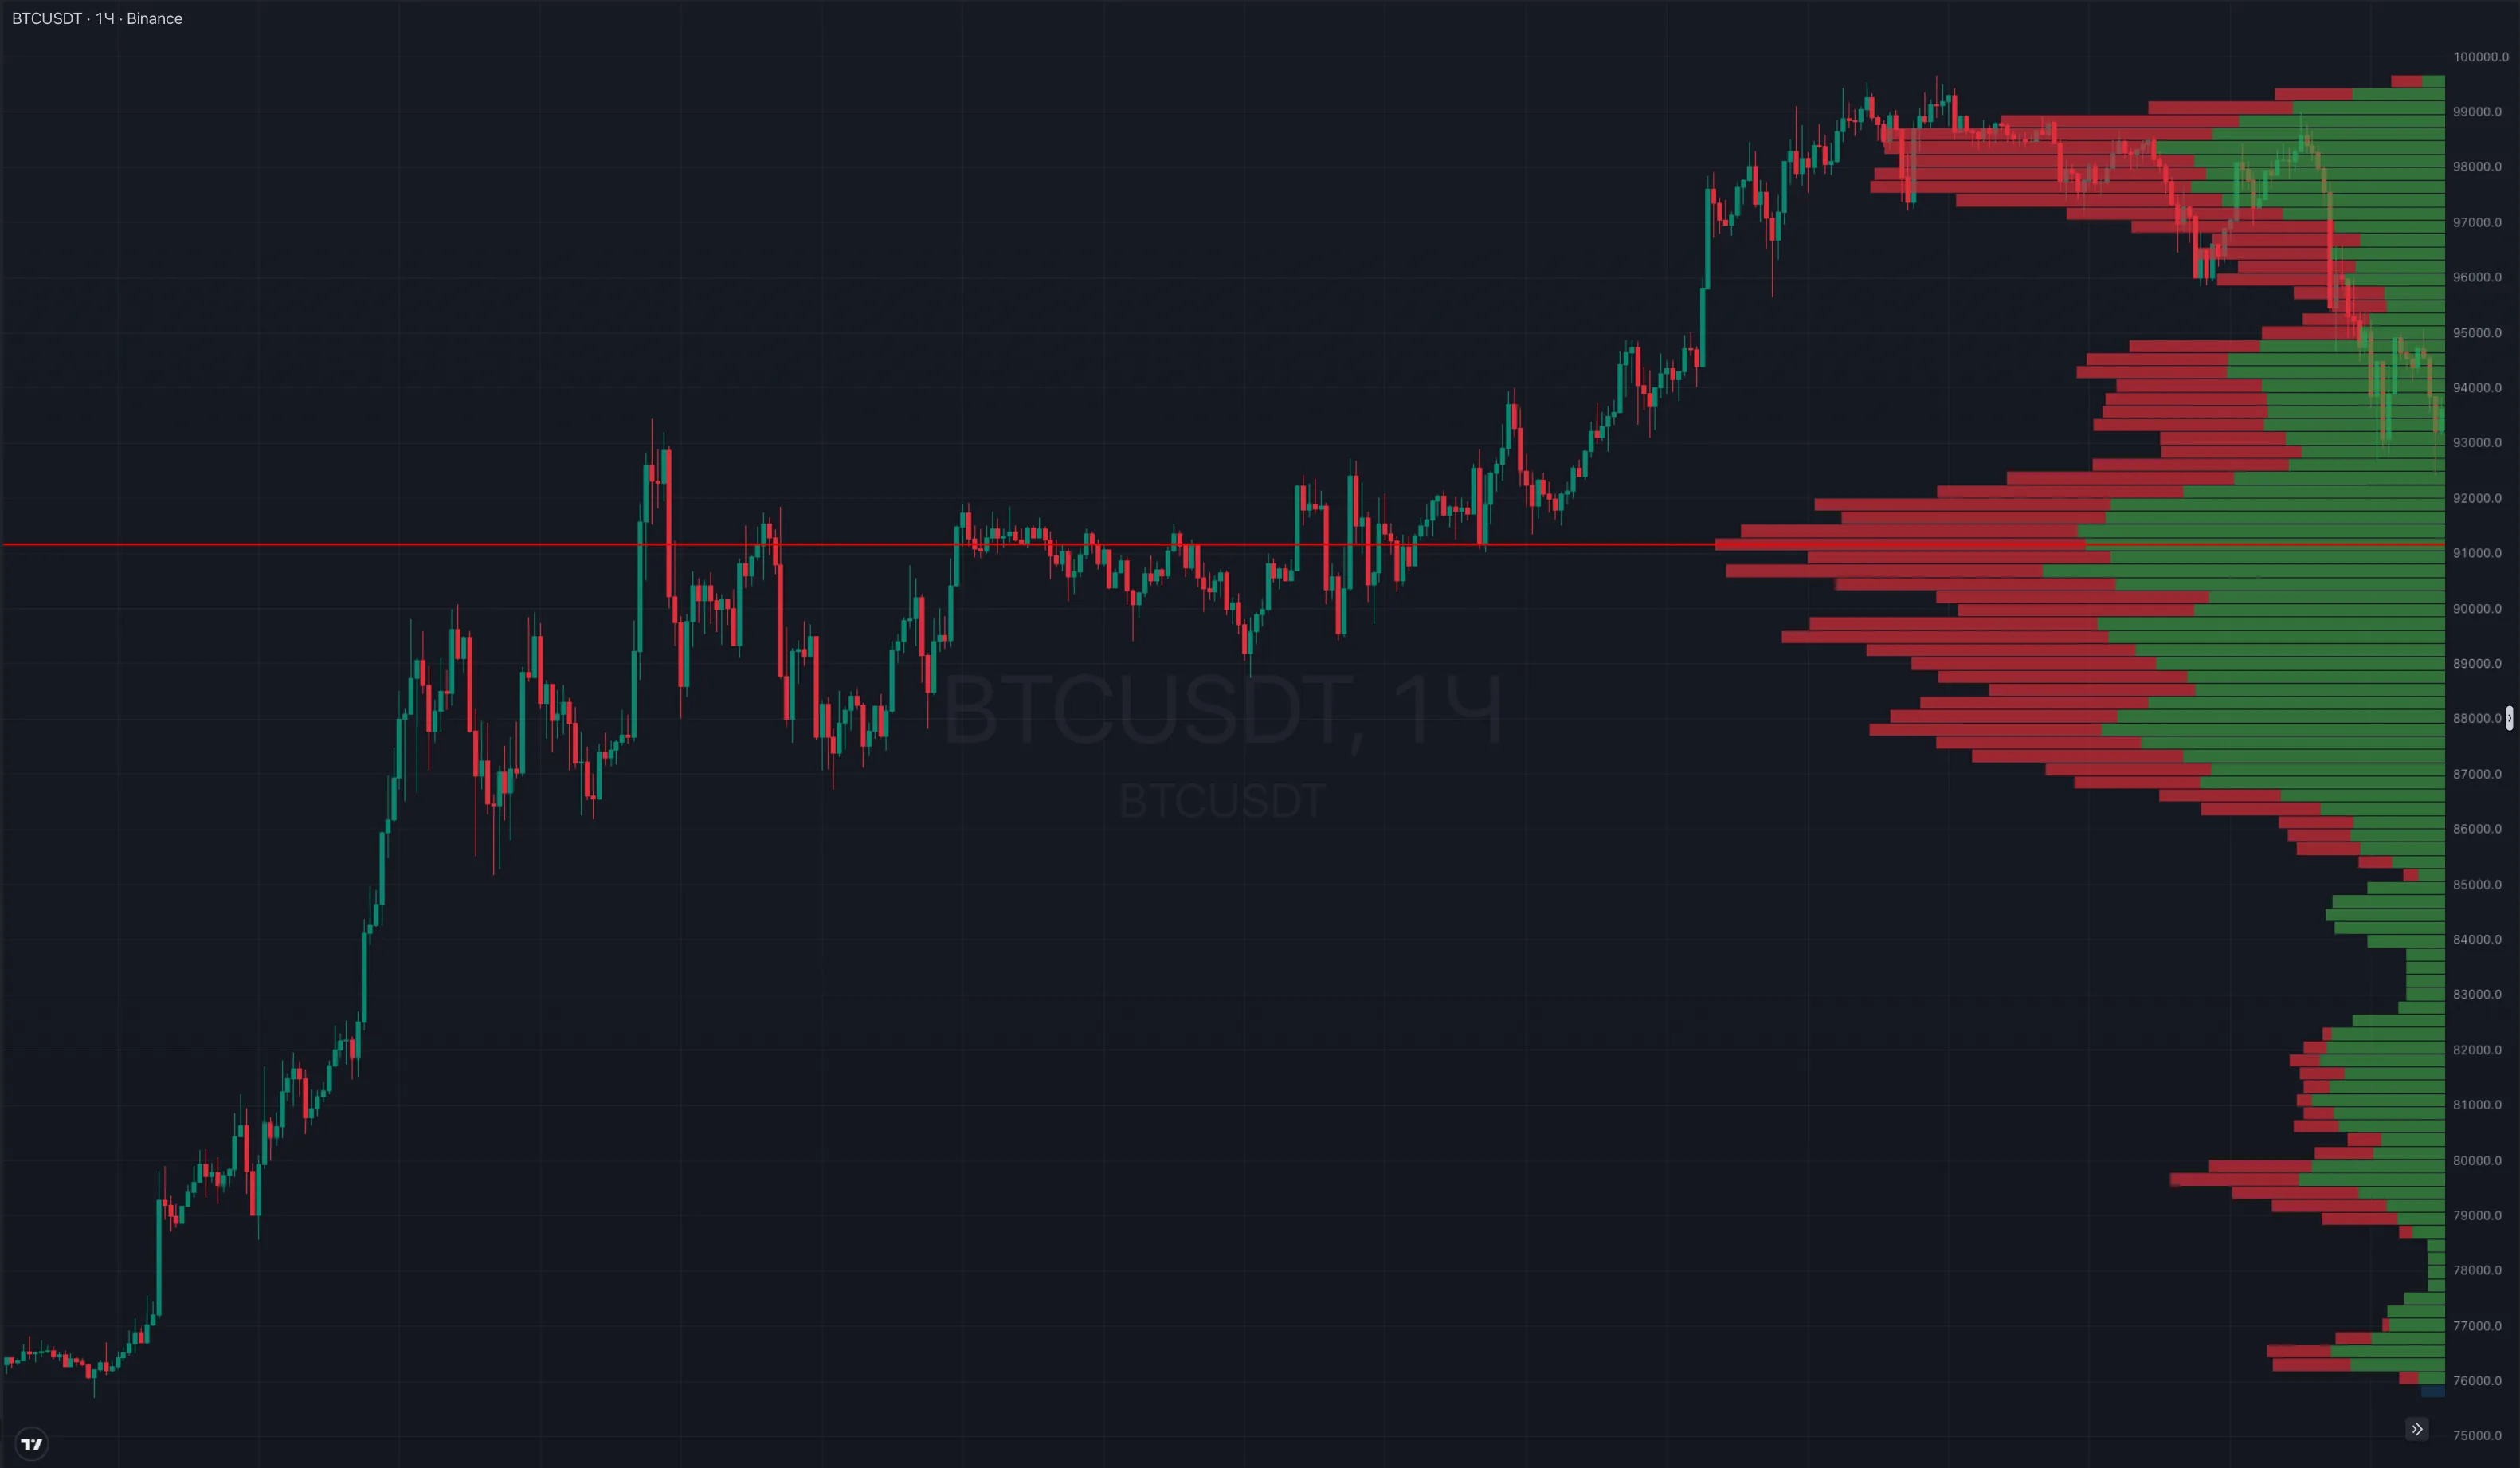
Horizontal volume: at which prices most trading happened
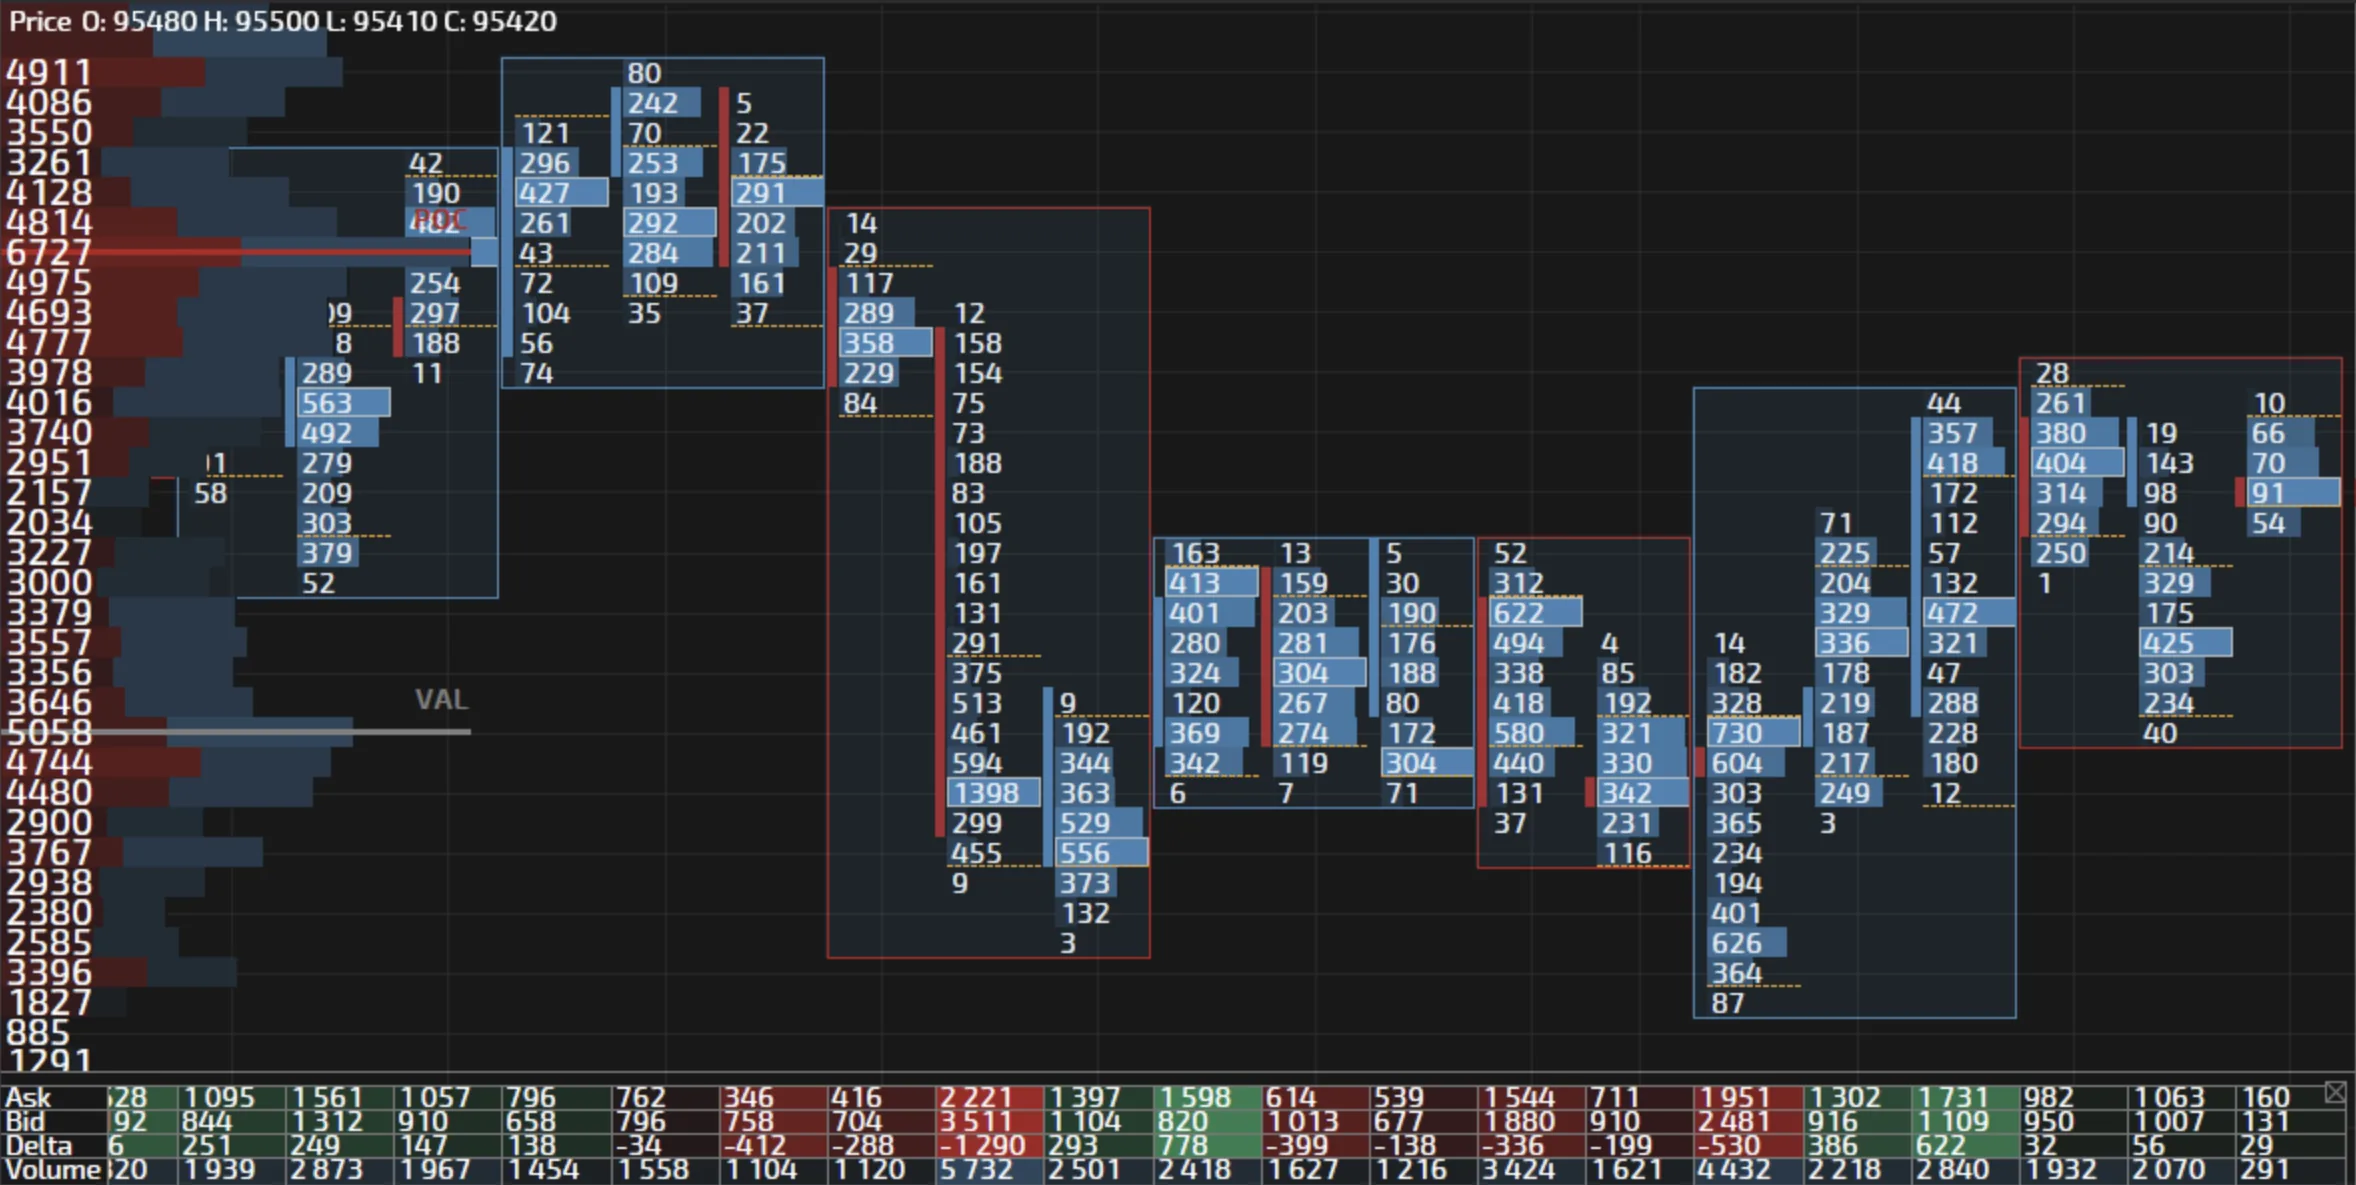
Cluster volume: where trading happened inside one candle
Trading volume FAQ
What is trading volume in simple terms?
How many coins were bought and sold over a period, such as 24 hours. Only completed trades count, and each trade counts toward volume once. The same volume in dollars is called turnover.
What is the difference between volume and turnover?
Volume is counted in coins, turnover in money: dollars or USDT. Turnover is roughly volume multiplied by price. Different coins can only be compared by turnover: a billion coins at $0.0001 is just $100,000.
Why did 24h volume drop when trading looks normal?
Daily volume is a rolling sum over the last 24 hours. When yesterday's busy hour falls out of the window, the number drops even if trading right now hasn't changed.
What does a volume spike mean?
A coin is trading well above its usual level: because of news, a listing, liquidations, or a large participant. A spike shows no direction — that comes from price, and on futures also from open interest.
Does rising volume mean buying?
No. Every trade has a buyer and a seller, so volume only shows activity. Volume rises on price rallies, on drops, and when price stands still.
How do I spot fake volume?
Signs: huge turnover with a thin order book, a price that barely moves, and a spike on one exchange while the rest stay quiet. Compare the pair's turnover across exchanges and check how many orders sit near the price.
How is volume different from open interest?
Volume is how much traded over a period. Open interest is how many futures positions are open right now. Volume can be high while open interest stays flat, if some traders close as much as others open.


